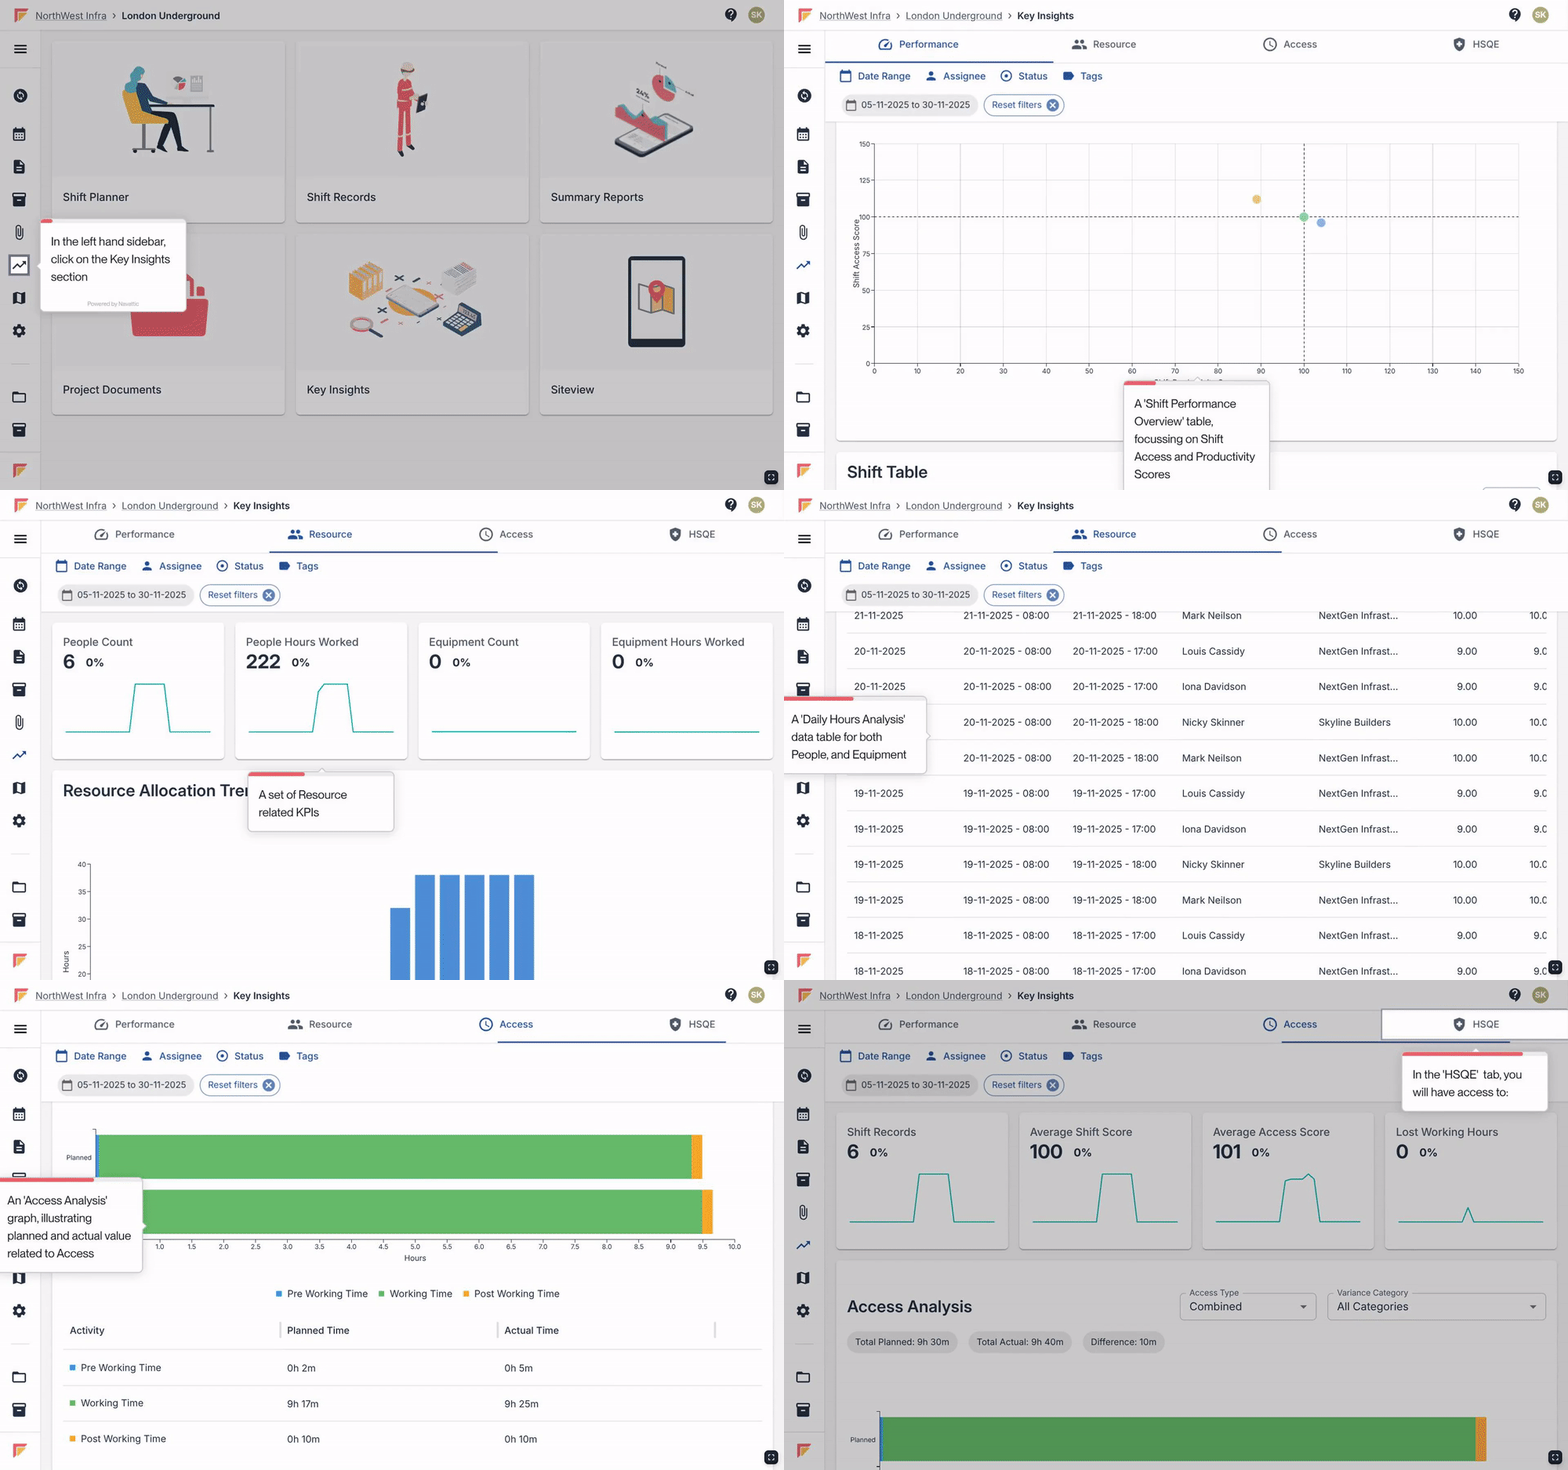
This article runs through Gather's Standard Key Insight dashboard for London Underground Projects, designed to empower you with a powerful tool for tracking Project progress.

Our London Underground dashboard covers the following:
Performance: KPIs (count of Shift Records over time, Average Shift Score over time, Average Access Score over time, Lost Working Time), Shift Performance Overview (Shift Access Score by Shift Productivity Score), Shift Table (Shift Start Date, Assignee, Activity Location, Discipline, Activity, UoM, Planned Quantity, Actual Quantity, Percentage Completed, Reason for Variance, Variance).
Resource: KPIs (People Count, People Hours Worked, Equipment Count, Equipment Hours Worked) Resource Allocation Trends (People Hours by week), Daily hours Analysis (Shift Start Date, Resource start/end, Name, Supplier, Planned Hours Worked, Actual Hours Worked, Total Travel Time, Total Hours).
Access: KPIs (count of Shift Records over time, Average Shift Score over time, Average Access Score over time, Lost Working Time), Access Analysis, Access Variance Categorisation
HSQE: KPIs (Count of Shift Records over time, count of Health & Safety Issues over time, Count of Environmental Issues, Hours Worked over time), HSQE Issues (Count of issues by week), HSQE Log (Shift Start Date, Assignee, Comment Date/Time, Category, Comment).