This article explains how to interpret the three key Shift Scores used in Gather Platform reports: Shift Access Score, Shift Productivity Score, and Shift Efficiency Score. These scores provide valuable insights into how well a shift went compared to planned activities and durations.
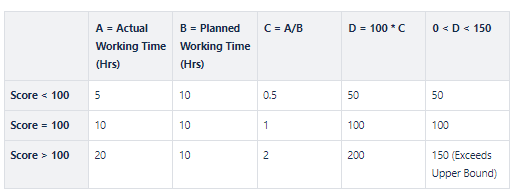
The Shift Access Score compares the planned working time of a shift to the actual working time. It indicates whether the shift team had sufficient access to the worksite to complete planned tasks.
Score Interpretation:
A score below 100 indicates less actual working time than planned.
A score above 100 indicates more actual working time than planned.
A score of 100 indicates the planned and actual working times matched.
Calculation:
Shift Access Score = (Actual Working Time / Planned Working Time) * 100 (bounded between 0 and 150)Example Calculations:
The Shift Productivity Score, often simply called Shift Score, assesses how well a shift performed compared to planned work. It considers both planned and unplanned activities.
Score Interpretation:
A score below 100 suggests issues arose and planned work wasn't fully completed.
A score above 100 indicates exceeding expectations and completing more than planned work.
A score of 100 signifies that planned work was completed as expected.
Calculation:
The Shift Productivity Score is an average of scores for each activity in the shift record, calculated as follows:
For each activity: Actual Quantity / Planned Quantity = Activity Score (capped at 100% for unplanned activities).
Calculate the average of all activity scores.
Scale the average to a score out of 100.
Example Calculation:
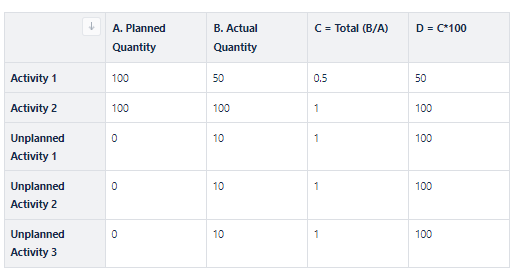
Adding up all the numbers in the final column gives us 450. Dividing this by 5 (the total number of activities) gives us a Shift Productivity Score of 90.
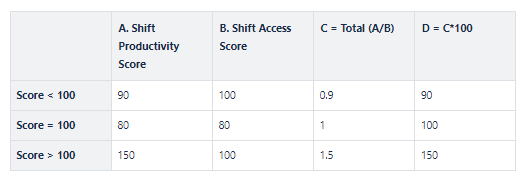
The Shift Efficiency Score combines the Shift Productivity Score and Shift Access Score to provide a holistic view of how efficiently a shift ran.
Score Interpretation:
A score below 100 indicates lower-than-expected productivity given the access time.
A score of 100 signifies that productivity and access matched expectations.
A score above 100 suggests high productivity despite access limitations.
Calculation:
Shift Efficiency Score = (Shift Productivity Score / Shift Access Score) * 100Example Calculation: